 |

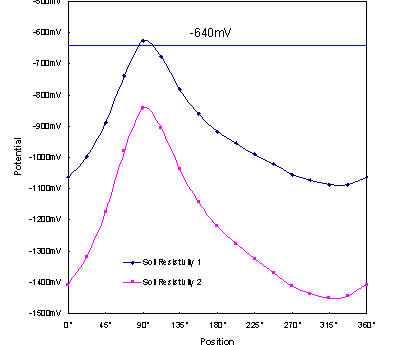
Figure 9 - Potential distribution around the bent pipe at the location most affected by the holiday on the straight pipe ("Soil resistivity 1" = 1´103Wm and "Soil resistivity 2" = 5x10²Wm).
Computer Simulation as an aid to CP System Design and Interference Predictions, Robert Adey and John Baynham, BEASY