Covering an average of 14 million square kmat its greatest extent in Februaryand now less than half this size at its smallest extent in the northern autumn, the Arctic's sea ice is a major driver of global weather systems. These changes in the Arctic climate and the richness of the untapped resources in this large area of the Planet have spurred a multitude of exploration and exploitation efforts. Some like the Trans-Alaska pipelinehave already been in the news due to environmental disasters.
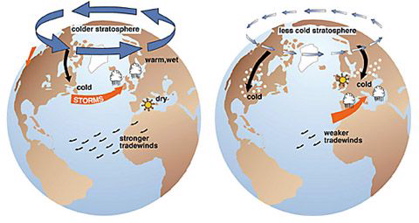
The Arctic Oscillation between opposing atmospheric pressure in northern middle (about 45 degrees North) and high latitudes exhibits a negative phasewith relatively high pressure over the polar region and low pressure at mid latitudes , and a positive phasein which the pattern is reversed. In the positive phase, higher pressure at mid latitudes drives ocean storms farther north, and changes in the circulation pattern bring wetter weather to Alaska, Scotland and Scandinavia, as well as drier conditions to the western part of North Americaand the Mediterranean. (reference)
In the positive phase, frigid winter air does not extend as far into the middle of North Americaas it would during the negative phase of the oscillation. This keeps much of North Americaeast of the Rocky Mountains warmer than normal, but leaves Greenlandand Newfoundlandcolder than usual. Weather patterns in the negative phase are in general oppositeto those of the positive phase, as illustrated below. Over most of the past century, the Arctic Oscillation alternated between its positive and negative phases. Starting in the 1970's, however, the oscillation has tended to stay in the positive phase, causing lower than normal arctic air pressure and higher than normal temperatures in much of North Americaand northern Eurasia.
Positive Phase on left, Negative phase on right (source:J. Wallace, University of Washington and NSIDC)
The 2008 Annual Arctic Report Card shows stronger effects of warming. Air temperatures which are at a record 5oC above normal, because of the major loss of sea ice in recent years. The loss of sea ice allows more solar heating of the ocean. That warming of the air and ocean affects land and marine life, and reduces the amount of winter sea ice that lasts into the following summer. (reference)
In this yearĺs report card, three of the six areas (atmosphere, sea ice, and Greenland) are coded red on the Report Card, indicating that the changes are strongly attributed to warming. The three remaining areas (biology, ocean, land) are coded yellow, indicating mixed signals. The 2007 Report Card had two red areas (atmosphere and sea ice) and four coded yellow.
Since satellites began surveying the Arctic in 1978, there has been a regular decrease in the area covered by ice in summer, with ice cover shrinking to its lowest level on record and opening up the most direct route through the Northwest Passage in September 2007.
About552 billion tons of ice melted this summerfrom the Greenland ice sheet, according to preliminary satellite data to be released by NASA Wednesday. That's 15 percent more than the annual average summer melt, beating 2005's record. (reference)
A record amount of surface ice was lost over Greenland this year, 12 percent more than the previous worst year, 2005. That's nearly quadruple the amount that melted just 15 years ago. The surface area of summer sea ice floating in the Arctic Ocean this summer was nearly 23 percent below the previous record. The dwindling sea ice already has affected wildlife, with 6,000 walruses coming ashore in northwest Alaska in October for the first time in recorded history. Another first: the Northwest Passage was open to navigation.
Still to be released is NASA data showing the remaining Arctic sea ice to be unusually thin, another record. That makes it more likely to melt in future summers. Combining the shrinking area covered by sea ice with the new thinness of the remaining ice, scientists calculate that the overall volume of ice is half of 2004's total. Alaska's frozen permafrost is warming, although it's not quite thawing yet. But temperature measurements 66 feet deep in the frozen soil rose nearly four-tenths of a degree from 2006 to 2007, according to measurements from the University of Alaska.
Current ice coverage in the Arctic has already reached the second absolute minimum since observations from space began 30 years ago. Because the extent of ice cover is usually at its lowest about mid-September, this year's minimum could still fall to set another record low.
The North Pole has become island for the first time in human history, and it is now possible to circumnavigate the Arctic ice cap. This was revealed by satellite images taken last week, showing that both the northwest and northeast passages are now open due to melting ice. These passages have not been open, simultaneously, since the beginning of the last Ice Age 125,000 years ago. Shipping companies are already planning to use the new routes. (reference)
Arctic freshwater systems are particularly sensitive to climate change because numerous hydro-ecological processes respond to even small changes in climate. These processes may adjust gradually to changes in climate, or abruptly as environmental or ecosystem thresholds are exceeded. This is especially the case for cryospheric or frozen components that significantly affect the water cycle of lakes, rivers, and ponds, the habitat characteristics of these freshwater systems; and the flora and fauna that occupy them. (reference)
In the case of large arctic rivers the effects of climate change must be evaluated for areas outside of as well as within the Arctic. The dynamics of such large systems depend on hydrologic processes prevailing within their water-rich headwaters in more temperate southern latitudes. In addition, many of these headwater areas are regulated in some way, a factor that may interact in some way with downstream arctic climate change impacts.
The significance of the physical and chemical processes taking place in the Arctic region extend far outside it. The polar area has been described as a refrigerator in the equator to pole transport of energy. As well as being an area where nutrients are recycled and released into the water, the Polar Front region in the North Atlanticplays a fundamental role in the driving of ocean currents. At the front near the Greenland, Iceland and Norwegian (GIN) seas and the Labrador Sea, warm salty water from the North Atlantic is cooled by Arctic waters and by intense heat loss to the atmosphere; it becomes more dense and sinks to deeper layers of the ocean. Salt rejected as sea ice forms also increases the densityand contributes to the process. (reference)
Although a slow process, this sinking takes place over a wide area and each winter several million cubic kilometres of water sinkand begin moving slowly south along the bottom of the Atlantic Ocean. It is known as thermohaline conveyor because it is driven in part by temperature and partly by salinity differences. The dense, cooled water becomes part of this gigantic Ocean Conveyor and the water eventually returns to the surface in theIndian and Pacific Oceans. As warm water returns to the Atlantic, the current moves towards the North Poleas the Gulf Streamand North Atlantic Drift, warming north western Europe substantially. In addition, the formation of deep-water also dissolves carbon dioxidefrom the atmosphere and effectively removes it. This is of significance in the global cycling of carbon. The Arctic region, therefore, plays a fundamental role in ocean circulation patterns, which in turn determine climate patterns over the rest of the globe.
Without the vast heat that these ocean currents deliver, comparable to the power generation of a million nuclear power plants, Europe's average temperature would likely drop 5 to 10░C, and parts of eastern North America would be chilled somewhat less. Such a dip in temperature would be similar to global average temperatures toward the end of the last ice age roughly 20,000 years ago. (reference)
Some scientists worry that melting Arctic sea ice will dump enough freshwater into the North Atlanticto interfere with sea currents. Some freshwater would come from the ice-melt itself, but the main contributor would be increased rain and snow in the region. Retreating ice cover exposes more of the ocean surface, allowing more moisture to evaporate into the atmosphere and leading to more precipitation.
The following Arctic map provides weather reports when you click on any one of the stations indicated by a dot. The scary thought is that if you look at the ice maps not only are the Northwest passage and the passage near the Siberian coast open but the ice in a narrow band on the north shore of Greenland is opening and it is not impossible that the globe could be circumnavigated at latitudes higher 70 well inside the Arctic circle. (reference)
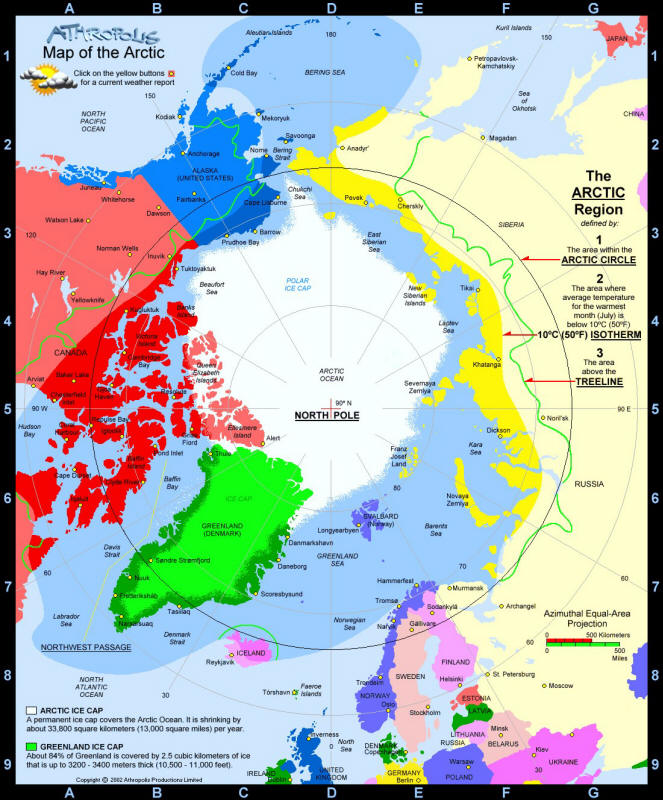
Tourist map of the arctic. Go to the Athropolis Web site to activate the weather station links
You want to share some ideas, or data with the visitors of the Corrosion Doctors Web site please send a note to our
Climate tipping points: Amazon Rainforest, Arctic Sea-Ice, Atlantic Thermohaline Circulation, Greenland Ice Sheet, Sahara/Sahel